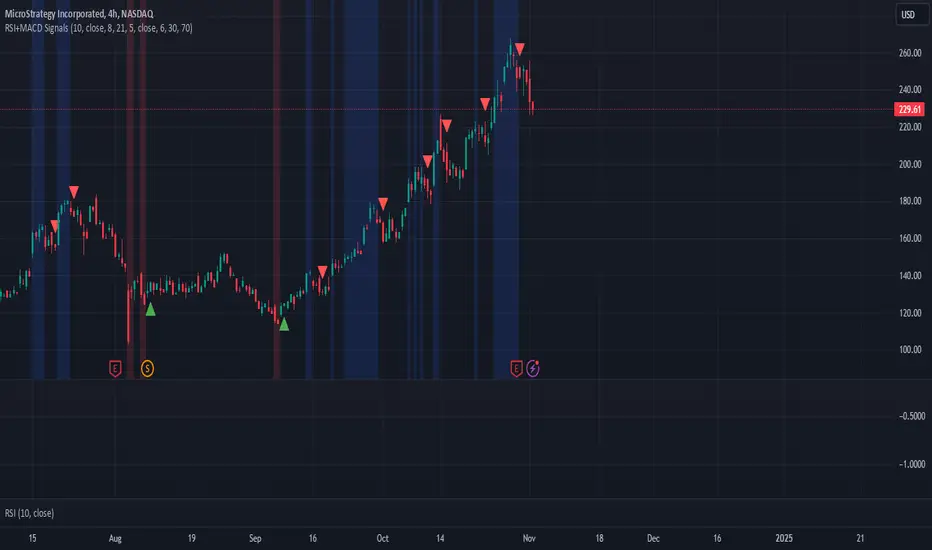
Ido strategy RSI Oversold with MACD Buy Signal Indicator
This indicator combines the Relative Strength Index (RSI) and the Moving Average Convergence Divergence (MACD) to help identify potential buy signals based on oversold conditions and trend reversals. This script is designed for traders looking to identify entry points when an asset is likely undervalued (oversold) and showing bullish momentum.
How It Works
RSI Oversold Detection: The RSI measures the speed and change of price movements. This indicator flags when the RSI falls below 30, signaling that the asset may be oversold. The user can customize the RSI lookback period and the timeframe within which oversold conditions are considered relevant.
MACD Crossover: The MACD line crossing above the Signal line often indicates a shift to bullish momentum. In this script, a buy signal is generated when a MACD bullish crossover occurs after an RSI oversold condition has been met within a user-defined lookback window.
Buy Signal: A green triangle appears below the price chart each time both conditions are met—when the RSI has recently been in oversold territory and the MACD line crosses above the Signal line. This signal suggests that the asset may be positioned for a potential upward trend, providing a visual cue for entry points.
Customizable Settings
RSI Settings: Adjust the RSI source and period length.
MACD Settings: Customize the fast, slow, and signal lengths of the MACD to suit different market conditions.
Lookback Period: Define how many bars back to check for an RSI oversold condition before confirming a MACD crossover.
Visual Elements
Oversold Background Color: The background on the price chart is shaded red whenever the RSI is below 30.
Buy Signal: A green triangle is displayed on the chart to indicate a potential entry point when both conditions are met.
Alerts
This indicator includes optional alerts, allowing traders to receive notifications whenever the conditions for a buy signal are met, making it easier to monitor multiple assets and stay informed of trading opportunities.
This indicator is ideal for traders using a combination of momentum and trend reversal strategies, especially in volatile markets where oversold conditions often precede a trend change.
"Relative Strength Index (RSI) " için komut dosyalarını ara
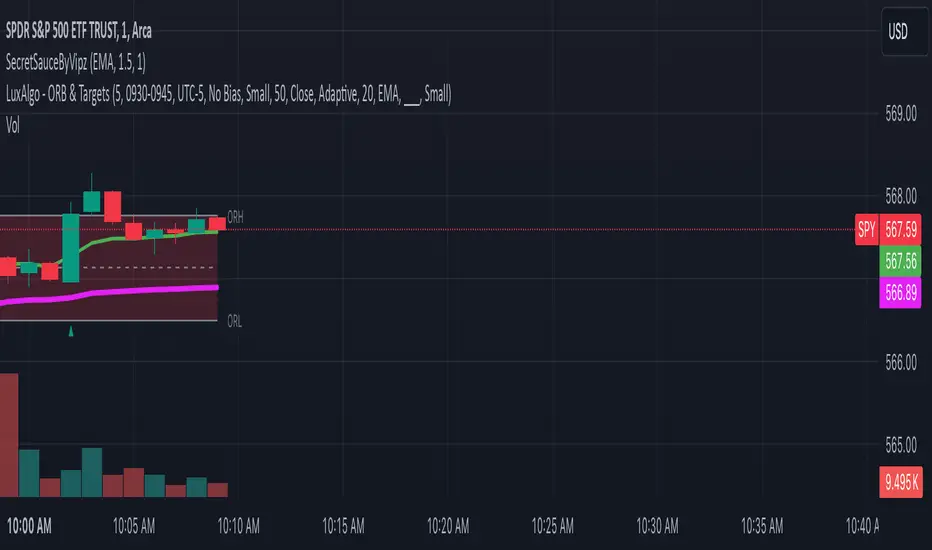
SecretSauceByVipzOverview:
SecretSauceByVipz is a sophisticated trading indicator designed to help traders identify high-probability buy and sell signals by integrating multiple technical analysis tools. By combining Exponential Moving Averages (EMAs), Average True Range (ATR) buffer zones, Volume Weighted Average Price (VWAP), and Relative Strength Index (RSI) momentum confirmation, this indicator aims to reduce false signals and enhance trading decisions.
Key Features:
Exponential Moving Averages (EMAs):
200-period EMA (Long EMA): Serves as a long-term trend indicator.
8-period EMA (Fast EMA): Captures short-term price movements.
21-period EMA (Slow EMA): Reflects medium-term price trends.
EMA Crossovers: Generates initial buy/sell signals when the fast EMA crosses over or under the slow EMA.
ATR-Based Buffer Zones:
ATR Calculation: Utilizes a 14-period ATR to measure market volatility.
Buffer Zone Multiplier: User-adjustable multiplier (default 1.0) applied to the ATR to create dynamic buffer zones around the 200 EMA.
Buffer Zones: Helps filter out false signals by requiring price to move beyond these zones for certain signals.
Volume Weighted Average Price (VWAP):
VWAP Plotting: Provides an average price weighted by volume, useful for identifying fair value areas and potential support/resistance levels.
Signal Confirmation Logic:
Confirmation Candle: Requires the next candle after a crossover to close in the signal's direction for added reliability.
Early Signals: Triggers when price crosses the 200 EMA and moves beyond the buffer zone, indicating potential early trend changes.
Strong Signals: Occur when both the price crosses the fast EMA and the fast EMA crosses the slow EMA simultaneously.
RSI Momentum Confirmation:
RSI Calculation: Uses a 14-period RSI to gauge market momentum.
Momentum Filter: Confirms signals only when RSI aligns with the trend (above 50 for bullish, below 50 for bearish signals).
Visual Aids:
EMA and VWAP Plots: Overlays the EMAs and VWAP directly on the price chart for easy visualization.
Buffer Zone Lines: Plots the upper and lower buffer zones around the 200 EMA.
Signal Labels:
Buy Signals: Displayed as green "BUY" labels below the bars.
Sell Signals: Displayed as red "SELL" labels above the bars.
How to Use:
Trend Identification:
Use the 200 EMA to determine the overall market trend.
Price above the 200 EMA suggests a bullish trend; below indicates a bearish trend.
Signal Generation:
Confirmed Signals: Wait for the confirmation candle after an EMA crossover before considering entry.
Early Signals: Consider early entries when price crosses the 200 EMA and moves beyond the buffer zone.
Strong Signals: Pay attention to strong signals where both price and EMAs are crossing over, indicating robust trend momentum.
Momentum Confirmation:
Ensure the RSI aligns with the signal direction:
Buy Signals: RSI should be above 50.
Sell Signals: RSI should be below 50.
Adjusting Sensitivity:
Modify the ATR Multiplier and Buffer Multiplier to suit different market conditions and personal trading styles.
A higher multiplier may reduce signal frequency but increase reliability.
Customization Parameters:
ATR Multiplier for Distance Filter (Default: 1.5):
Adjusts the sensitivity of the distance filter based on ATR.
Buffer Multiplier for 200 EMA (Default: 1.0):
Alters the width of the buffer zones around the 200 EMA.
Benefits:
Reduces False Signals: The combination of confirmation candles and buffer zones helps filter out noise.
Enhances Trend Detection: Multiple EMA crossovers provide insights into short-term and medium-term trends.
Incorporates Volatility and Momentum: ATR and RSI ensure signals consider market volatility and momentum.
Disclaimer:
This indicator is a tool to assist in technical analysis and should not be used as the sole basis for trading decisions. Always conduct thorough analysis and consider risk management strategies before executing trades. Past performance is not indicative of future results.
Credits:
Developed by Vipink1203.
Version:
Pine Script Version 5
Weekly RSI Buy/Sell SignalsWeekly RSI Buy/Sell Signal Indicator
This indicator is designed to help traders identify high-probability buy and sell opportunities on the weekly chart by using the Relative Strength Index (RSI). By utilizing weekly RSI values, this indicator ensures signals align with broader market trends, providing a clearer view of potential price reversals and continuation.
How It Works:
Weekly RSI Calculation: This script calculates the RSI using a 14-period setting, focusing on the weekly timeframe regardless of the user’s current chart view. The weekly RSI is derived using request.security, allowing for consistent signals even on intraday charts.
Signal Conditions:
Buy Signal: A buy signal appears when the RSI crosses above the oversold threshold of 30, suggesting that price may be gaining momentum after a potential bottom.
Sell Signal: A sell signal triggers when the RSI crosses below the overbought threshold of 70, indicating a possible momentum shift downwards.
Visual Cues:
Buy/Sell Markers: Clear green "BUY" and red "SELL" markers are displayed on the chart when buy or sell conditions are met, making it easy to identify entry and exit points.
RSI Line and Thresholds: The weekly RSI value is plotted in real time with color-coded horizontal lines at 30 (oversold) and 70 (overbought), providing a visual reference for key levels.
This indicator is ideal for traders looking for reliable, trend-based signals on higher timeframes and can be a helpful tool for filtering out shorter-term market noise.

RSI Ignoring Gaps Between DaysThe RSI Ignoring Gaps Between Days indicator is an advanced modification of the traditional Relative Strength Index (RSI) designed to exclude price gaps that occur between the last bar of one trading day and the first bar of the next. This ensures that the RSI calculations remain focused on the actual price action during the trading session, avoiding distortions caused by overnight price gaps.
Key Features:
Gap Ignoring Mechanism: The indicator detects when a new day begins and skips the price change between the last bar of the previous day and the first bar of the current day. This ensures that only the intra-day price changes are included in the RSI calculation.
Intra-day Price Movement: The RSI calculations are based on real price changes within each trading day, providing a clearer reflection of momentum without interference from overnight events.
Dynamic RSI Calculation: The traditional RSI formula is preserved, but gains and losses are recalculated based on price changes from bar to bar within the same day.
Overbought/Oversold Levels: The indicator retains standard RSI overbought (70) and oversold (30) levels, allowing traders to easily identify potential reversal zones.
Alerts for Crossovers: Built-in alert conditions trigger when the RSI crosses key levels (30 or 70), signaling potential buying or selling opportunities.
This indicator is particularly useful for traders looking to focus on intra-day price action and avoid the influence of gaps caused by overnight market activity. It is suitable for intraday trading strategies where consistency in price movement measurement is crucial.
Buy/Sell IndicatorBuy/Sell Indicator
Overview
The Buy/Sell Indicator is designed to help traders identify potential entry and exit points in the market using a combination of Simple Moving Averages (SMA) and the Relative Strength Index (RSI). This indicator plots buy and sell signals directly on the chart, making it easier to make informed trading decisions.
Inputs
Fast MA Length: The period for the fast-moving average. Default is 9.
Slow MA Length: The period for the slow-moving average. Default is 21.
RSI Length: The period for the RSI calculation. Default is 14.
RSI Overbought Level: The RSI level considered overbought. Default is 70.
RSI Oversold Level: The RSI level considered oversold. Default is 30.
How It Works
Moving Averages:
The indicator calculates two SMAs: a fast-moving average (fastMA) and a slow-moving average (slowMA).
The fast MA reacts more quickly to price changes, while the slow MA reacts more slowly.
RSI:
The RSI is calculated to measure the momentum of price movements.
It helps identify overbought and oversold conditions in the market.
Buy and Sell Conditions:
Buy Signal: A buy signal is generated when the fast MA crosses above the slow MA and the RSI is below the overbought level.
Sell Signal: A sell signal is generated when the fast MA crosses below the slow MA and the RSI is above the oversold level.
Plotting
Buy Signals: Displayed as green labels below the bars where the buy condition is met.
Sell Signals: Displayed as red labels above the bars where the sell condition is met.
Moving Averages: The fast MA is plotted in blue, and the slow MA is plotted in orange.

RSI Divergence and GradientThe RSI Divergence and Gradient Indicator simplifies the process of identifying the relationship between price action and the Relative Strength Index (RSI). By integrating RSI data directly into the price chart, traders no longer need to open a separate pane to monitor RSI or manually compare price action and RSI.
This indicator allows traders to easily spot overbought or oversold conditions and detect divergences between price and RSI. These signals can help identify potential reversal points and more effectively assess trend strength.
Features
RSI Divergences: The script identifies and plots bullish and bearish RSI divergences, which can signal potential reversals. Bullish divergences are indicated by an upward triangle below the price bars, while bearish divergences are indicated by a downward triangle above the price bars.
Overbought/Oversold Gradient: The script uses a color gradient to highlight overbought and oversold conditions on the chart, helping traders visualize momentum and trend strength. The gradient dynamically adjusts based on RSI values, transitioning through different colors to represent the intensity of overbought or oversold conditions.
Customizable Gradient: The gradient is customizable, allowing traders to set their own thresholds for overbought and oversold levels, and to choose the colors that best suit their trading style. This flexibility ensures the indicator can be tailored to individual preferences.
How It Works
RSI Calculation: The indicator calculates RSI using the standard 14-period length by default, but this can be adjusted to suit the trader's needs.
Divergence Detection: The script identifies divergences by comparing the highest and lowest points of the RSI with the corresponding price levels over the RSI period length. When a divergence is detected, it is plotted on the chart to indicate a potential reversal.
Gradient Coloring: The gradient coloring system changes the bar colors based on RSI levels. The color transitions from a neutral tone to specified start and end colors as RSI approaches overbought or oversold thresholds, providing a visual cue for potential overextended market conditions.
Intended Use
This indicator is particularly useful for traders who want to combine momentum analysis with divergence signals to identify potential reversal points or confirm trend strength. The visual gradient aids in quickly assessing market conditions, making it easier to spot high-probability trading opportunities.

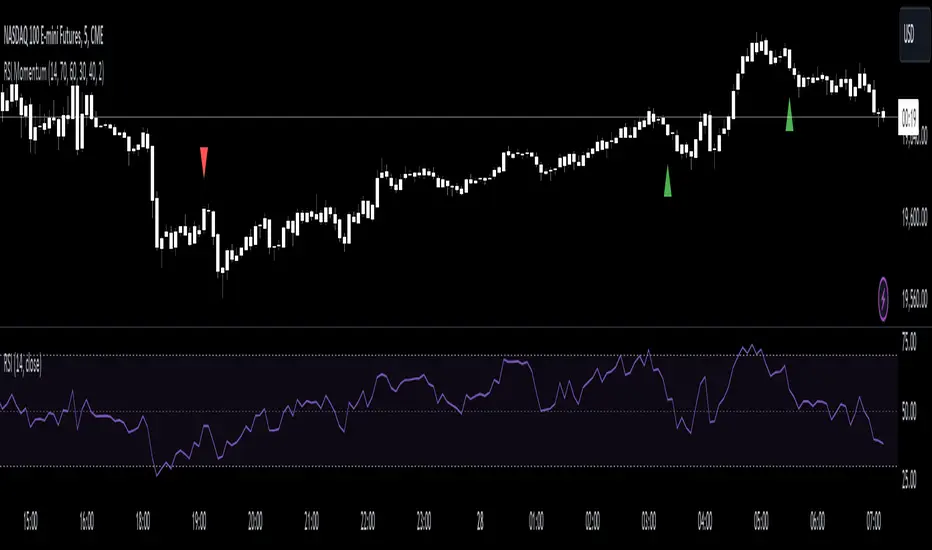
RSI Momentum [CrossTrade]The RSI Momentum indicator generates buy and sell signals based on the Relative Strength Index (RSI) crossing specific thresholds. The Key difference is that we're using RSI overbought and oversold readings as the foundation for finding continuation signals in the same direction of that momentum. This solves the issue of trying to buy the bottom or sell the top and offsets any oscillators main weakness, divergence and false signals in a strong trend.
Key Parameters:
RSI Length: Determines the calculation period for the RSI.
Overbought Threshold: The RSI level above which the asset is considered overbought.
Momentum Loss Threshold for Buy: The RSI level below which a loss in upward momentum is indicated, triggering a potential buy signal.
Oversold Threshold: The RSI level below which the asset is considered oversold.
Momentum Loss Threshold for Sell: The RSI level above which a loss in downward momentum is indicated, triggering a potential sell signal.
Allow Additional Retracement Signals: A toggle to allow more than one signal within a certain number of bars after the first signal.
Max Additional Signals: The maximum number of additional signals allowed after the first signal.
Buy Signal Logic:
Initial Signal: Generated when the RSI first exceeds the overbought threshold and then falls below the momentum loss buy threshold. Defaults are 70 for the overbought threshold and 60 for the retracement level.
Additional Signals for Deeper Retracements: If enabled, the script shows additional buy signals within the maximum limit set by Max Additional Signals. These additional signals are shown only if each new signal's bar has a lower low than the previous signal's bar.
Sell Signal Logic:
Initial Signal: Similar to the buy signal, a sell signal is generated when the RSI first drops below the oversold threshold and then rises above the momentum loss sell threshold. Defaults are 30 for the oversold threshold and 40 for the retracement level.
Additional Signals for Deeper Retracements: If enabled, additional sell signals are shown, limited by Max Additional Signals, and only if each new signal's bar has a higher high than the previous signal's bar.
Continuation Signals in Strong Trends:
The script allows for a new series of signals (starting with the first signal again) when the RSI pattern repeats. For buy signals, this means going above the overbought and then below the momentum loss buy threshold. For sell signals, it's dropping below oversold and then above the momentum loss sell threshold.
Alerts:
The script includes alert conditions for both buy and sell signals, which can be configured in the TradingView alerts.
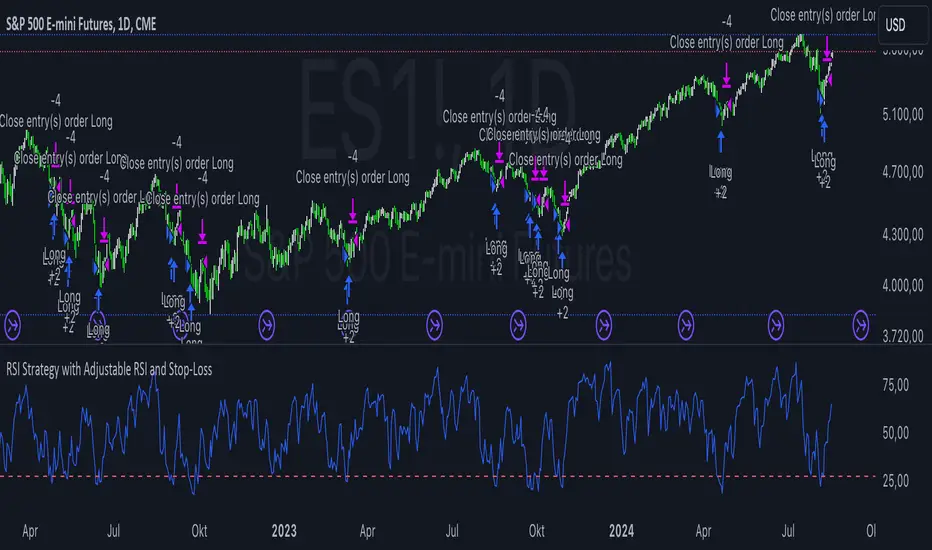
RSI Strategy with Adjustable RSI and Stop-LossThis trading strategy uses the Relative Strength Index (RSI) and a Stop-Loss mechanism to make trading decisions. Here’s a breakdown of how it works:
RSI Calculation:
The RSI is calculated based on the user-defined length (rsi_length). This is a momentum oscillator that measures the speed and change of price movements.
Buy Condition:
The strategy generates a buy signal when the RSI value is below a user-defined threshold (rsi_threshold). This condition indicates that the asset might be oversold and potentially due for a rebound.
Stop-Loss Mechanism:
Upon triggering a buy signal, the strategy calculates the Stop-Loss level. The Stop-Loss level is set to a percentage below the entry price, as specified by the user (stop_loss_percent). This level is used to limit potential losses if the price moves against the trade.
Sell Condition:
A sell signal is generated when the current closing price is higher than the highest high of the previous day. This condition suggests that the price has reached a new high, and the strategy decides to exit the trade.
Plotting:
The RSI values are plotted on the chart for visual reference. A horizontal line is drawn at the RSI threshold level to help visualize the oversold condition.
Summary
Buying Strategy: When RSI is below the specified threshold, indicating potential oversold conditions.
Stop-Loss: Set based on a percentage of the entry price to limit potential losses.
Selling Strategy: When the price surpasses the highest high of the previous day, signaling a potential exit point.
This strategy aims to capture potential rebounds from oversold conditions and manage risk using a Stop-Loss mechanism. As with any trading strategy, it’s essential to test and optimize it under various market conditions to ensure its effectiveness.
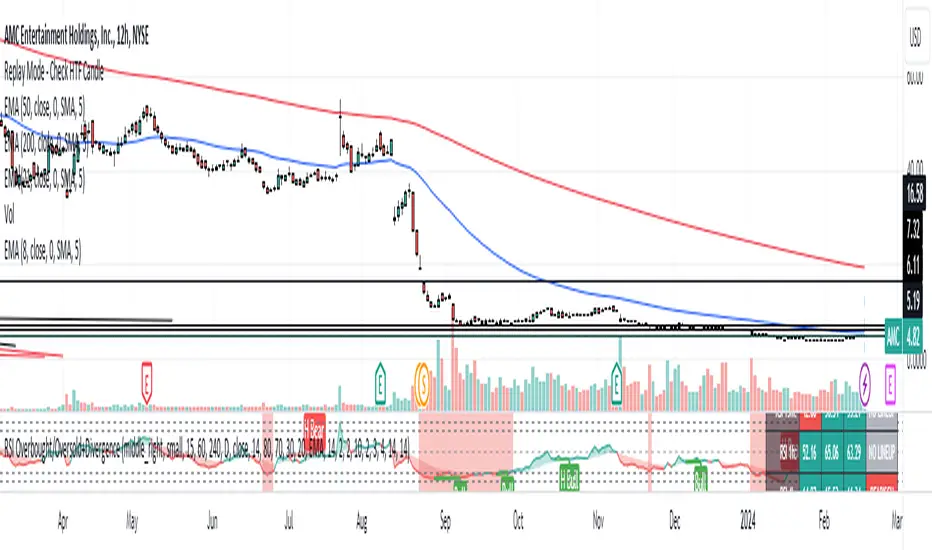
Supply and Demand Zones with Enhanced SignalsThis Pine Script indicator combines supply and demand zone analysis with dynamic buy/sell signals to enhance trading strategies. It provides a robust framework for identifying optimal trading opportunities and managing existing trades.
Key Features:
Supply and Demand Zones: The indicator identifies significant supply and demand zones based on recent price action. These zones are plotted as horizontal lines to help traders visualize potential reversal points.
Exponential Moving Average (EMA): A 21-period EMA is used to determine the prevailing trend and generate buy and sell signals.
Relative Strength Index (RSI): The 14-period RSI is utilized to filter buy and sell signals, providing additional context on overbought and oversold conditions.
Signal Generation:
Buy Signal: Triggered when the price crosses above the EMA and RSI indicates that the market is not overbought.
Sell Signal: Triggered when the price crosses below the EMA and RSI indicates that the market is not oversold.
Enhanced Exit Signals:
Exit Buy Signal: Generated if an opposite sell signal occurs or the higher timeframe RSI indicates overbought conditions.
Exit Sell Signal: Generated if an opposite buy signal occurs or the higher timeframe RSI indicates oversold conditions.
Trade Management:
Tracks active trades and provides exit signals based on the occurrence of opposite trading signals. This helps in managing positions more effectively and reducing potential losses.
Usage:
Supply and Demand Zones: Look for price action around these zones to identify potential trading opportunities.
EMA and RSI: Use buy and sell signals in conjunction with EMA and RSI to validate trading decisions.
Higher Timeframe RSI: Utilize this for additional confirmation and exit signals.
Plotting:
Supply Zone: Plotted as a red horizontal line.
Demand Zone: Plotted as a green horizontal line.
EMA: Plotted as a blue line.
Buy and Sell Signals: Indicated by green and red triangle shapes, respectively.
Exit Signals: Indicated by blue and orange X shapes.
This indicator is designed to help traders make informed decisions by combining technical analysis with strategic trade management.

HMA Crossover 1H with RSI, Stochastic RSI, and Trailing StopThe strategy script provided is a trading algorithm designed to help traders make informed buy and sell decisions based on certain technical indicators. Here’s a breakdown of what each part of the script does and how the strategy works:
Key Components:
Hull Moving Averages (HMA):
HMA 5: This is a Hull Moving Average calculated over 5 periods. HMAs are used to smooth out price data and identify trends more quickly than traditional moving averages.
HMA 20: This is another HMA but calculated over 20 periods, providing a broader view of the trend.
Relative Strength Index (RSI):
RSI 14: This is a momentum oscillator that measures the speed and change of price movements over a 14-period timeframe. It helps identify overbought or oversold conditions in the market.
Stochastic RSI:
%K: This is the main line of the Stochastic RSI, which combines the RSI and the Stochastic Oscillator to provide a more sensitive measure of overbought and oversold conditions. It is smoothed with a 3-period simple moving average.
Trading Signals:
Buy Signal:
Generated when the 5-period HMA crosses above the 20-period HMA, indicating a potential upward trend.
Additionally, the RSI must be below 45, suggesting that the market is not overbought.
The Stochastic RSI %K must also be below 39, confirming the oversold condition.
Sell Signal:
Generated when the 5-period HMA crosses below the 20-period HMA, indicating a potential downward trend.
The RSI must be above 60, suggesting that the market is not oversold.
The Stochastic RSI %K must also be above 63, confirming the overbought condition.
Trailing Stop Loss:
This feature helps protect profits by automatically selling the position if the price moves against the trade by 5%.
For sell positions, an additional trailing stop of 100 points is included.

Statistical RSI Pivot Reversal Indicator [UAlgo]🔶 Idea
The "Statistical RSI Pivot Reversal Indicator " is designed to enhance traditional RSI analysis by incorporating statistical methods to identify potential reversal points more accurately. The core concept is to detect frequently occurring pivot points in the RSI data, which can indicate strong support or resistance levels. By analyzing the most frequent RSI values at these pivots, the script provides traders with clearer signals for potential market reversals, helping to improve the timing of entry and exit points in their trading strategies.
🔶 Key Features
Enhanced RSI Analysis:
This script calculates the Relative Strength Index (RSI) based on user-defined parameters and identifies pivot points in the RSI data. By analyzing these pivots, it detects the most frequently occurring RSI values at support and resistance levels.
Signal Filtering Options:
Filter buy and sell signals based on whether the RSI is in overbought (above 70) or oversold (below 30) conditions, enhancing the reliability of signals.
Visual and Alert Features:
Visual Signals: The script plots the RSI, the most frequent high and low RSI values, and buy/sell signals on the chart.
Alerts: Set up custom alerts for buy and sell conditions, ensuring you never miss a trading opportunity.
🔶 Disclaimer
The "Statistical RSI Pivot Reversal Indicator " script is intended for educational and informational purposes only.
It does not constitute financial advice or investment recommendations.
Trading financial instruments involves risk, and it is possible to lose more than your initial investment. Past performance is not indicative of future results.

Support Resistance base Volume RSIThe indicator displays support and resistance levels based on volume and the Relative Strength Index (RSI).
Variable and Input Assignment:
lookback: Determines the period for data lookback.
RsiVisible, RsilabelSize, OversoldForRsi, OverboughtForRsi: Various inputs to adjust RSI indicator parameters.
Indicator Calculation:
highestVol: Finds the highest volume within a certain period.
Rsi: Calculates the RSI value with a period of 14.
roc: Calculates the Rate of Change.
Support and Resistance Level Determination:
Uses a comparison between price change (roc) and RSI value to determine whether the price is rising or falling.
If the price is rising and the current volume is greater than the previous highest volume, a new resistance level is established.
If the price is falling and the current volume is greater than the previous highest volume, a new support level is established.
Support and Resistance Lines:
Creates lines indicating the latest support and resistance levels.
These lines are updated whenever there is a change in support or resistance levels.
RSI Labels:
Displays the RSI value above or below the price chart depending on whether the RSI is above or below the overbought or oversold levels.
If the RSI value is above the overbought level, the label is displayed above the price.
If the RSI value is below the oversold level, the label is displayed below the price.
Labels are removed if the corresponding conditions are not met.
Additional RSI Label:
Adds an additional label displaying the RSI value next to the price chart on the last bar.
The main purpose of this script is to assist traders in identifying support and resistance levels based on price movement, volume, and the RSI indicator. Thus, traders can use this information to make better trading decisions.

Multi Timeframe RSI Buy Sell Strategy [TradeDots]The "Multi Timeframe RSI Buy/Sell Strategy" is a trading strategy that utilizes Relative Strength Index (RSI) indicators from multiple timeframes to provide buy and sell signals.
This strategy allows for extensive customization, supporting up to three distinct RSIs, each configurable with its own timeframe, length, and data source.
HOW DOES IT WORK
This strategy integrates up to three RSIs, each selectable from different timeframes and customizable in terms of length and source. Users have the flexibility to define the number of active RSIs. These selections visualize as plotted lines on the chart, enhancing interpretability.
Users can also manage the moving average of the selected RSI lines. When multiple RSIs are active, the moving average is calculated based on these active lines' average value.
The color intensity of the moving average line changes as it approaches predefined buying or selling thresholds, alerting users to potential signal generation.
A buy or sell signal is generated when all active RSI lines simultaneously cross their respective threshold lines. Concurrently, a label will appear on the chart to signify the order placement.
For those preferring not to display order information or activate the strategy, an "Enable backtest" option is provided in the settings for toggling activation.
APPLICATION
The strategy leverages multiple RSIs to detect extreme market conditions across various timeframes without the need for manual timeframe switching.
This feature is invaluable for identifying divergences across timeframes, such as detecting potential short-term reversals within broader trends, thereby aiding traders in making better trading decisions and potentially avoiding losses.
DEFAULT SETUP
Commission: 0.01%
Initial Capital: $10,000
Equity per Trade: 60%
RISK DISCLAIMER
Trading entails substantial risk, and most day traders incur losses. All content, tools, scripts, articles, and education provided by TradeDots serve purely informational and educational purposes. Past performances are not definitive predictors of future results.
TradeDots Stochastic Z-Score

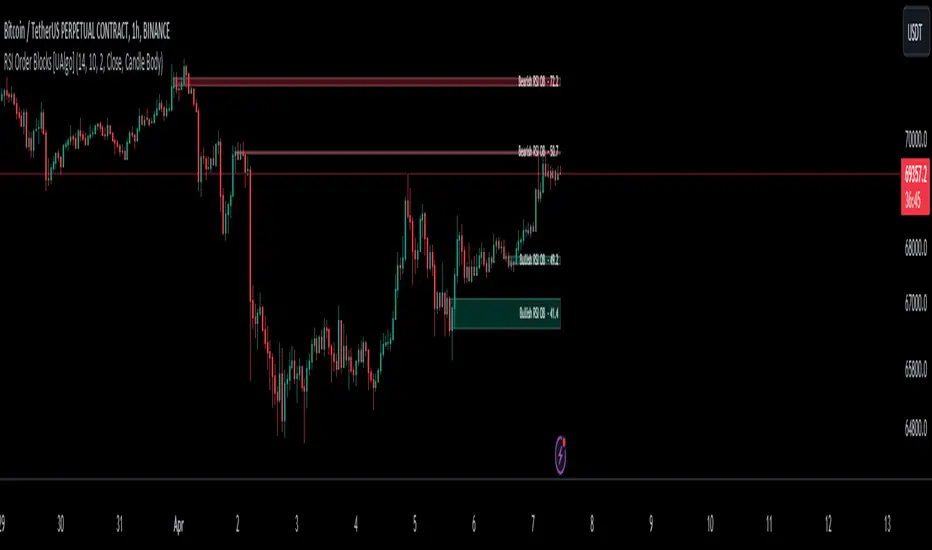
RSI Order Blocks [UAlgo]The "RSI Order Blocks " identifies and visualizes potential order blocks based on the Relative Strength Index (RSI) indicator. These zones may indicating potential support or resistance levels.
🔶 Key Features :
RSI-based Order Block Identification: The script utilizes the RSI indicator to identify potential order blocks. It detects pivot highs and lows in the RSI, which are indicative of potential reversal points, and marks these areas as potential order blocks.
Order Block Visualization: Identified order blocks are visually represented on the chart, making it easy for traders to recognize and interpret these significant price zones. Both bullish and bearish order blocks are differentiated by color, enhancing clarity and ease of analysis. Additionally, within each order block, the RSI value of that block is also shown.
RSI Overbought/Oversold Filter: Optionally, users can apply a filter based on RSI levels to refine the detection of order blocks. This filter prevents the creation of order blocks when the RSI is within specified overbought or oversold conditions (default between 30 and 70), helping traders focus on areas of potentially significant price action.
An Example with the OB/OS Filter Feature Turned Off:
An Example with the OB/OS Filter Feature Turned On:
Mitigation of Broken Order Blocks: Provides flexibility in selecting the mitigation method (based on close or wick) for determining order block breaches.
Customizable Parameters: The script offers a range of customizable parameters to tailor the detection and visualization of order blocks to suit individual trading preferences. Users can adjust parameters such as RSI Length, Order Block Detection Sensitivity, Mitigation Method, and order block style to fine-tune the analysis according to their trading strategy.
🔶 Disclaimer :
Not Financial Advice: This indicator is intended for educational and informational purposes only. It does not constitute financial advice or recommendations to buy, sell, or hold any financial instruments.
Use at Own Risk: Trading involves substantial risk of loss and is not suitable for all investors. Users of this indicator should exercise caution and conduct their own research and analysis before making any trading decisions.
Performance Not Guaranteed: Past performance is not indicative of future results. While the indicator aims to assist traders in analyzing market trends, there is no guarantee of accuracy or success in trading operations.
Multi-Spectral RSI Deviations [AlgoAlpha]🌌 Multi-Spectral RSI Deviations by AlgoAlpha - Dive into Market Dynamics! 🌠
Dive deep into the essence of market trends with our 🚀 Multi-Spectral RSI Deviations indicator, a comprehensive tool designed by AlgoAlpha to enhance your trading strategy. By harnessing the power of multiple RSI lengths and innovative smoothing techniques, this indicator offers a unique perspective on market momentum and potential reversals.
🔍 Key Features:
🎨 Customizable up and down colors for immediate trend recognition.
🔢 Three RSI lengths for multi-layered market analysis.
🔄 Various Moving Average (MA) types including SMA, EMA, and more for tailored smoothing.
✅ Bullish and Bearish divergence plotting for spotting potential reversals.
🕵️♂️ Adjustable divergence sensitivity settings to fine-tune signal detection.
🔔 Built-in alerts for trend shifts and reversal conditions, ensuring you never miss a trading opportunity.
🚀 Quick Guide to Using the Multi-Spectral RSI Deviations Indicator
🛠 Add the Indicator: Search for "Multi-Spectral RSI Deviations" in TradingView's Indicators & Strategies. Adjust the RSI lengths and MA settings to suit your trading strategy.
🔍 Market Analysis: Keep an eye on the color changes for trend direction and use divergence plots to anticipate potential market reversals.
🔔 Alerts Setup: Activate the built-in alerts for trend shifts and reversals to stay ahead of the game without having to constantly monitor the charts.
🧠 How It Works:
At the core of the Multi-Spectral RSI Deviations indicator is its ability to analyze the market through various RSI lengths, providing a comprehensive view of momentum. The indicator calculates the Relative Strength Index (RSI) over three different periods, creating a spectrum of momentum insights. These RSI values are then compared to each other to identify the momentum shifts within the market.
To refine these insights, the differences between these RSI values are smoothed using a selected Moving Average type, such as SMA, EMA, etc., based on user preference. This smoothing process helps in highlighting the overall trend direction and potential reversal points with greater clarity.
Furthermore, the indicator employs a color-coding system, where the plotted line changes color based on the momentum's direction—shifting to an up color for positive momentum and a down color for negative momentum. This visual cue enables traders to quickly discern the market trend at a glance.
Divergences between the price action and the indicator's values are another cornerstone of this tool. By plotting potential bullish and bearish divergences, the indicator provides early signals of possible trend reversals, offering traders a strategic advantage.
Embrace the power of our 🌌 Multi-Spectral RSI Deviations and elevate your trading to stellar heights! 🌠✨

Fusion Traders - RSI Overbought/Oversold + Divergence IndicatorFusion Traders - RSI Overbought/Oversold + Divergence Indicator - new version
This indicator has lots of various add ons.
RSI overbought / oversold with changeable inputs
Divergence indicator
DESCRIPTION:
This script combines the Relative Strength Index ( RSI ), Moving Average and Divergence indicator to make a better decision when to enter or exit a trade.
- The Moving Average line (MA) has been made hidden by default but enhanced with an RSIMA cloud.
- When the RSI is above the selected MA it turns into green and when the RSI is below the select MA it turns into red.
- When the RSI is moving into the Overbought or Oversold area, some highlighted areas will appear.
- When some divergences or hidden divergences are detected an extra indication will be highlighted.
- When the divergence appear in the Overbought or Oversold area the more weight it give to make a decision.
- The same colour pallet has been used as the default candlestick colours so it looks familiar.
HOW TO USE:
The prerequisite is that we have some knowledge about the Elliot Wave Theory, the Fibonacci Retracement and the Fibonacci Extension tools.
We are hoping you like this indicator and added to your favourite indicators. If you have any question then comment below, and I'll do my best to help.
FEATURES:
• You can show/hide the RSI .
• You can show/hide the MA.
• You can show/hide the lRSIMA cloud.
• You can show/hide the Stoch RSI cloud.
• You can show/hide and adjust the Overbought and Oversold zones.
• You can show/hide and adjust the Overbought Extended and Oversold Extended zones.
• You can show/hide the Overbought and Oversold highlighted zones.
HOW TO GET ACCESS TO THE SCRIPT:
• Favorite the script and add it to your chart.
RSI Volatility Bands [QuantraSystems]RSI Volatility Bands
Introduction
The RSI Volatility Bands indicator introduces a unique approach to market analysis by combining the traditional Relative Strength Index (RSI) with dynamic, volatility adjusted deviation bands. It is designed to provide a highly customizable method of trend analysis, enabling investors to analyze potential entry and exit points in a new and profound way.
The deviation bands are calculated and drawn in a manner which allows investors to view them as areas of dynamic support and resistance.
Legend
Upper and Lower Bands - A dynamic plot of the volatility-adjusted range around the current price.
Signals - Generated when the RSI volatility bands indicate a trend shift.
Case Study
The chart highlights the occurrence of false signals, emphasizing the need for caution when the bands are contracted and market volatility is low.
Juxtaposing this, during volatile market phases as shown, the indicator can effectively adapt to strong trends. This keeps an investor in a position even through a minor drawdown in order to exploit the entire price movement.
Recommended Settings
The RSI Volatility Bands are highly customisable and can be adapted to many assets with diverse behaviors.
The calibrations used in the above screenshots are as follows:
Source = close
RSI Length = 8
RSI Smoothing MA = DEMA
Bandwidth Type = DEMA
Bandwidth Length = 24
Bandwidth Smooth = 25
Methodology
The indicator first calculates the RSI of the price data, and applies a custom moving average.
The deviation bands are then calculated based upon the absolute difference between the RSI and its moving average - providing a unique volatility insight.
The deviation bands are then adjusted with another smoothing function, providing clear visuals of the RSI’s trend within a volatility-adjusted context.
rsiVal = ta.rsi(close, rsiLength)
rsiEma = ma(rsiMA, rsiVal, bandLength)
bandwidth = ma(bandMA, math.abs(rsiVal - rsiEma), bandLength)
upperBand = ma(bandMA, rsiEma + bandwidth, smooth)
lowerBand = ma(bandMA, rsiEma - bandwidth, smooth)
long = upperBand > 50 and not (lowerBand < lowerBand and lowerBand < 50)
short= not (upperBand > 50 and not (lowerBand < lowerBand and lowerBand < 50))
By dynamically adjusting to market conditions, the RSI trend bands offer a unique perspective on market trends, and reversal zones.

RSI Divergence AlertsIndicator Description: RSI Divergence Alerts
The RSI Divergence indicator is a technical analysis tool that identifies divergences between the Relative Strength Index (RSI) and the price of an asset. The RSI is a momentum indicator that measures the speed and magnitude of recent changes in an asset's price, while divergences occur when there is a disparity between price movements and the RSI.
Indicator Customization:
Overbought and Oversold: The indicator allows you to customize the overbought and oversold levels of the RSI. This allows traders to adjust parameters according to their preferences and the historical behavior of the asset in question.
Indicator Settings and Recommended Adjustments:
Max Bar Distance: This parameter determines the maximum distance allowed between two low or high points for a divergence to be recognized. A higher value may result in more signals, but may also increase the number of false signals. It is recommended to adjust this value based on the volatility of the asset and the time period in which it is being traded.
RSI Length: This is the time period used to calculate the RSI. A longer period smoothes the indicator, while a shorter period makes it more sensitive to price changes. The default value is 14, but traders can adjust it based on their trading strategy and the asset's volatility.
RSI Overbought and Oversold: These values determine the levels at which the RSI is considered overbought and oversold, respectively. The default value for overbought is 75 and for oversold is 35. Traders can adjust these values according to the asset's volatility and its historical analysis. For example, in more volatile assets, it may be useful to use more extreme levels, such as 80 for overbought and 20 for oversold.
When adjusting indicator settings, traders must consider the balance between sensitivity and accuracy. Careful tuning of these parameters can help filter out false signals and identify more reliable trading opportunities.
The alerts functionality in this RSI Divergence indicator is designed to notify traders when a bearish divergence or a bullish divergence is detected. Here's how it works:
Conditionally Triggered Alerts:
Alerts are triggered based on the boolean variables bearishDivergence and bullishDivergence.
If bearishDivergence is true, it indicates that a bearish divergence has been detected.
If bullishDivergence is true, it indicates that a bullish divergence has been detected.
Alert Message:
When a divergence is detected, an alert message is generated to inform the trader about the event.
The message includes details about the divergence, such as the difference in the RSI value between the two points forming the divergence.
For example, for a bearish divergence, the message will include the phrase "Bearish RSI Divergence Detected" and the RSI difference between the high and low points of the divergence.
Alert Frequency:
Alerts are configured to be triggered once per bar close (alert.freq_once_per_bar_close), which means the alert will only be sent once at the close of each bar.
This helps to avoid multiple alerts for the same divergence during the same time period.
Additional Alert Conditions:
In addition to conditionally triggered alert messages, alert conditions are defined for both bearish and bullish divergences.
These alert conditions are useful for configuring custom alerts on trading platforms that support running Pine Script code.
Overall, this alert functionality allows traders to stay informed about potential trading opportunities based on divergences detected by the indicator. This can help traders make faster and more informed decisions in their trading processes.

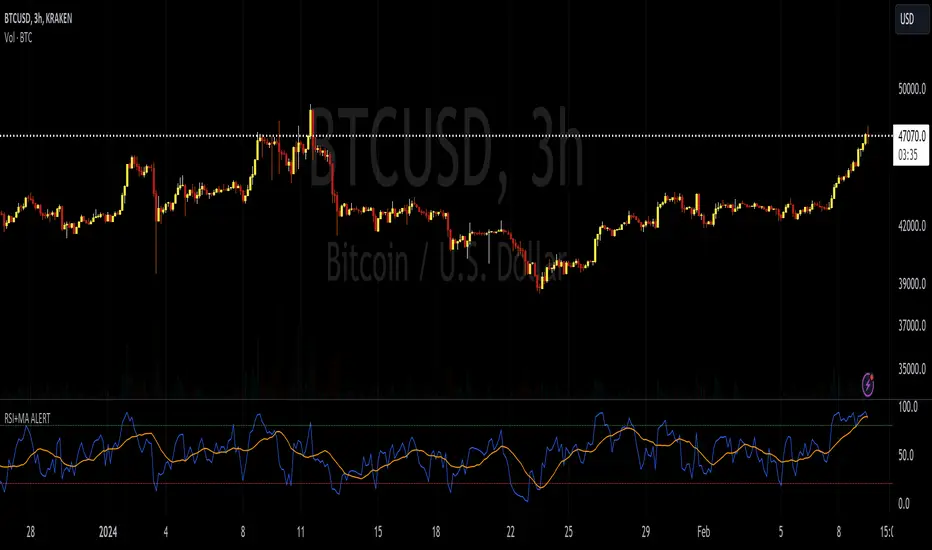
RSI+MA ALERTThis script is a custom indicator for use on the TradingView platform, which combines the Relative Strength Index (RSI) with a moving average applied to the RSI itself to smooth its movements and potentially identify trends or reversals more clearly.
The RSI is a momentum oscillator that measures the speed and variation of asset price movements. RSI values range from 0 to 100 and are generally considered overbought when above 70 and oversold when below 30. In our indicator, we adjust these levels to 80 and 20, respectively, to avoid premature or delayed signals. Furthermore, we have inserted customizable options within the script that allow the user to define their own overbought and oversold thresholds, thus improving compatibility with different strategies and market conditions.
The overbought metric means that the price may be at a point of downward reversal, while an oversold state may indicate an imminent upward reversal point. These levels are visualized as dotted horizontal lines on the indicator chart for guidance.
To capture the behavior of the RSI over time, we apply a simple moving average (SMA) to the RSI values, thereby smoothing the RSI graph and highlighting the broader trend of oscillator movement. This helps filter out the noise from smaller price movements and provides a clearer representation of trend momentum.
Regarding alerts, the indicator is programmed to send notifications when the RSI value crosses the defined overbought and oversold levels. This means that when the RSI drops below 20, the indicator triggers an oversold alert, while an RSI above 80 triggers an overbought alert. These levels, however, are user adjustable in code, allowing custom levels to be defined to match individual strategies.
Visually, the indicator plots two lines on the chart below the main price chart: a blue line for the RSI values and an orange line for the RSI moving average. The red (oversold - 20) and green (overbought - 80) horizontal lines delimit the critical levels, although these are also customizable. These are the fundamental features of this indicator that make it a useful tool for analyzing momentum and potentially identifying price reversals.
RSI in Candlestick MODEDescription:
The "RSI Bar" indicator is a versatile tool designed to enhance your technical analysis on trading charts. This Pine Script™ code calculates the Relative Strength Index (RSI) for open, close, high, and low prices, and represents the results as bars on the chart. The bars are color-coded based on whether the closing RSI is higher or lower than the opening RSI.
Additionally, the indicator incorporates advanced features such as Pareto analysis and Gaussian smoothing. The Pareto analysis helps identify significant lows and highs in the RSI, providing insights into potential trend reversals. The Gaussian smoothing further refines the analysis, contributing to a more accurate representation of the average RSI trend.
Key Features:
RSI calculation for open, close, high, and low prices.
Color-coded bars for easy visualization of RSI trends.
Pareto analysis to highlight key RSI levels indicating potential reversals.
Gaussian smoothing for improved trend analysis and visualization.
Heiken-Ashi

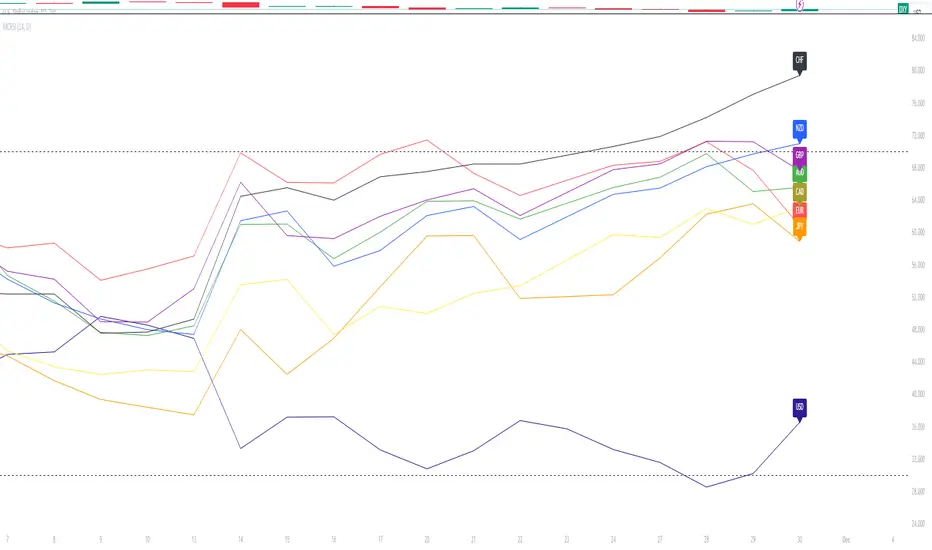
Major Currency RSI Indicator (MCRSI)Experience the power of multi-dimensional analysis with our Multi-Currency RSI Indicator (MCRSI). This innovative tool allows traders to simultaneously track and compare the Relative Strength Index (RSI) of eight different currencies in a single chart.
The MCRSI calculates the RSI for USD (DXY), EUR (EXY), JPY (JXY), CAD (CXY), AUD (AXY), NZD (ZXY), GBP (BXY), and CHF (SXY), covering a broad range of the forex market. Each RSI line is color-coded for easy differentiation and equipped with labels at the last bar for a clutter-free view.
Our indicator is designed with user-friendly customization features. You can easily adjust the length of the RSI and the time frame according to your trading strategy. It also handles gaps in the chart data with the barmerge.gaps_on option, ensuring accurate and consistent RSI calculations.
Whether you are a novice trader seeking to understand market dynamics better or an experienced trader wanting to diversify your technical analysis, the MCRSI offers a unique perspective of the forex market. This multi-currency approach can help identify potential trading opportunities that could be missed when analyzing currencies in isolation.
Harness the power of multi-currency RSI analysis with our MCRSI Indicator. It's time to step up your trading game!
Features:
Tracks 8 different currencies simultaneously
Color-coded RSI lines for easy identification
Customizable RSI length and time frame
Handles gaps in chart data
Last bar labels for a clutter-free view
Ideal for forex traders of all experience levels
How to Use:
Add the MCRSI to your TradingView chart.
Adjust the RSI length and time frame as needed.
Monitor the RSI lines and their intersections for potential trading signals.
Happy trading!
Multi Time Frame RSI PanelDescription:
The "Multi Time Frame RSI Panel" indicator is a powerful tool designed to help traders analyze the Relative Strength Index (RSI) across multiple timeframes simultaneously. While the core logic of this indicator is proprietary, this description aims to provide traders with an understanding of its functionality and utility.
Key Features:
Multi-Timeframe Analysis: This indicator displays RSI values for different timeframes, including 1 minute (1m), 5 minutes (5m), 15 minutes (15m), 30 minutes (30m), 1 hour (1h), 2 hours (2h), 4 hours (4h), and 1 day (1d). Traders can choose which timeframes to display on their chart based on their trading strategy.
Customizable Thresholds: Users can set upper and lower RSI thresholds for each timeframe, allowing for the identification of overbought and oversold conditions. The indicator highlights RSI values that breach these thresholds in green (for overbought) or red (for oversold), providing visual cues for potential trading opportunities.
How to Use:
1. Add the "Multi Time Frame RSI Panel" indicator to your TradingView chart.
2. Configure the settings by selecting the timeframes you want to monitor and setting your preferred RSI thresholds.
3. Monitor the RSI values for each selected timeframe in the panel located at the top right corner of your chart.
4. Look for potential trading signals based on RSI conditions, such as overbought or oversold levels, across different timeframes.

RSI-Volume Oscillator Quick Scalping By Akhilesh PatelTitle: RSI-Volume Oscillator Quick Scalping Indicator
Description:
The "RSI-Volume Oscillator Quick Scalping" is a powerful and versatile custom indicator designed for traders who engage in scalping strategies. This indicator combines the Relative Strength Index (RSI) with a Volume Oscillator to provide valuable insights into momentum and volume dynamics in the market. Traders can also select their preferred moving average types (SMA, EMA, or HMA) to further customize the indicator's behavior.
Key Features:
RSI and Volume Oscillator Fusion: The indicator blends the RSI and a custom Volume Oscillator to offer a comprehensive view of both price momentum and volume trends. This integration provides valuable signals for quick scalping opportunities.
Customizable Moving Averages: Traders can choose from three popular moving average types (SMA, EMA, or HMA) for further customization. This flexibility allows users to align the indicator with their preferred trading strategies.
Clear Visualization: The Combined RSI-Volume Oscillator is plotted as a solid blue line, while the three selected moving averages are represented by orange, purple, and green lines, respectively. The zero line, overbought, and oversold levels for RSI are also indicated for easy reference.
Quick Scalping Signals: The indicator helps traders spot potential buy and sell signals efficiently, making it ideal for quick scalping strategies in rapidly moving markets.
Usage Instructions:
Customize the indicator by selecting your preferred RSI length, Volume Oscillator length, and moving average type (SMA, EMA, or HMA).
Observe the Combined RSI-Volume Oscillator and moving averages for potential entry and exit points.
Look for crossovers between the Combined RSI-Volume Oscillator and the selected moving averages for buy and sell signals.
The overbought (70) and oversold (30) levels for RSI can be used to identify potential reversal points.
Important Note:
Test the indicator on historical data and demo accounts before using it in live trading to ensure it aligns with your trading strategy.
Understand that no indicator guarantees profits, and trading involves risk. Always use proper risk management and discipline when executing trades.
Overall, the "RSI-Volume Oscillator Quick Scalping" indicator is a valuable addition to any scalper's toolkit, providing comprehensive insights into momentum and volume dynamics to enhance trading decisions. Happy scalping!
